Automated traffic signal performance measures (ATSPM) are taking traffic engineering into a new era. The capabilities of both hardware and software solutions have caught up with the needs of a modern agency and are enabling an objective and performance-based approach to signal performance measures(SPM).
Jason Spencer, Territory Manager for Western Systems, recently walked through a detailed overview of how an ATSPM system puts petabytes of reliable data at your fingertips. Now, agencies can easily monitor the health of their traffic signal systems, identify maintenance and operational issues before they become problems, and much more. He also provided a first look at the newest release from the ATSPM industry leader – Iteris.
Standard SPM: Model and React
Today, standard SPMs are based on designing and adjusting a model. The Highway Capacity Manual has become the guiding document for traffic signal timing design and is incorporated into a lot of the software that agencies use. The process generally looks like this:
- Manually collect turning movement counts, in hourly data sets.
- Feed that data into a specific time/space diagram to design a model for coordinating signals.
- Evaluate the program based on manual, floating car studies and/or public complaints.
- Tweak the model based on data from evaluations and public feedback.
- Repeat steps 3-4 until satisfied with the signal’s performance
There are, obviously, a lot of problems with this process. Issues take a long time to discover and then, sometimes, more time to diagnose. Additionally, after a few years of reactive tweaks and updates, the system becomes far removed from the original model and much less coordinated overall. Every three to five years, the agency has to start the process all over.
It’s an expensive, never-ending cycle, but without a reliable stream of timely data, it’s about the best any agency can do.
Standard Signal Maintenance: Too Much or Not Enough
Similar complications make signal maintenance a constant challenge. Most agencies are constantly trying to balance preventative and emergency maintenance needs and costs.
Spending more on preventative maintenance requires more resources up-front, but generally reduces the amount spent on emergency maintenance. Less spending on preventative maintenance saves resources now but potentially increases the cost of emergency maintenance.
The optimum place to be is right in the middle, but traditional systems don’t provide the kind of data that agencies need to find and maintain that balance.
High-Resolution Data: A Huge Step Forward
In 2005, Purdue University, in partnership with the Indiana Department of Transportation (IDoT) and a few controller manufacturers, pioneered high-resolution data. This suddenly provided the capability to log a wider variety of data to a controller, faster than ever (10 times per second).
That data wasn’t available remotely—it had to be manually collected at the controller—but it was a huge step forward in understanding how intersections were performing. Before high-resolution data, volume and occupancy metrics were only available in 15-minute bins. Now, data sets are much more detailed, allowing agencies to:
- Prove the safety of roadways and intersections.
- Provide faster response times for maintenance needs.
- Understand demand trends, allowing for future expansion and upgrades.
Overall, these detailed data sets saved time, money, and lives by providing better information about intersection functionality. The next step would be finding a way to interpret and present that data more efficiently.
ATSPM: The Missing Link Between Traffic Data and Signal Control Management
In 2012, the Utah Department of Transportation (UDoT) released the Automated Traffic Signal Performance Measures (ATSPM)—a suite of performance measures, high-resolution data collection tools, and data analysis tools that can support an objective- and performance-based approach to managing a traffic signal program. This was the missing link between traffic data and signal control management.
ATSPM made signal timing more efficient and more dynamic. Agencies no longer had to rely on the cycle of modeling, testing, tweaking, and remodeling. The automated system enabled a proactive approach to signal timing, saving time and money.
ATSPM also allowed agencies to flatten spending on signal maintenance and operations. The availability of specific, detailed data can alert crews when equipment is not working properly and help diagnose specific issues. Agencies are no longer losing time identifying equipment issues or trying to troubleshoot the problem.
The only remaining issue was the ATSPM software. Because it is user-driven, the software is free and open-source. However, that means it’s not very user-friendly, users must search and filter the data they are looking for across all of the intersections they manage, making the process somewhat slow and tedious. Because this system is open-source and free, it doesn’t come with tech support either. Users also need to be familiar with the Linux platform in order to be proficient with the software.
Iteris: The Modern SPM Solution
Iteris is a California-based company that has made a name for themselves by developing hardware and software that spans several branches of the traffic world. They’ve developed industry-leading detection equipment, as well as several tools for multi-modal and signal operations support.
The Iteris SPM system is an ideal solution for the last hurdle that agencies face in making the most of their ATSPM. It takes all of that detailed data and translates it into a complete library of visualizations, so agencies can optimize insights and put the metrics to work.
Iteris does it all with your existing hardware, stores petabytes of data in the cloud, and presents the information you need in a user-friendly, web-based browser.
Iteris SPM Hardware Requirements
The hardware requirements for the Iteris SPM system are minimal, and you probably already have them.
- Linux-based controller — The system has grown out of the 2005 model, so it’s Linux-based. That means you need a Linux board on your controller
- Ethernet or wireless connectivity — The system sends your traffic data to the cloud for storage and processing, so you need ethernet or wireless connectivity from the controller.
- Detection — Detection systems can be video, loops, radar, or a combination of the above. The more detection you have, the more data you will be able to pull into the system.
The Iteris system is completely hardware agnostic, so it works with your current setup. This is especially helpful for agencies that are using different controllers at different intersections, and for multi-agency partnerships. The Iteris SPM can lay over the top of existing hardware.
Hardware: Iteris Vantage Vector
While the Iteris system works with any detection hardware, it is worth pointing out that they’ve also developed one of the best detection devices on the market. The Vantage Vector combines optical and radar detection, for reliable performance in any condition.
- The radar detection is especially helpful in regions like the Pacific Northwest, where we get a lot of cloudy, foggy, rainy weather. Radar detection means the device doesn’t need perfect weather or lighting to get lane-by-lane detection as far as 600 feet back
- Then, because Iteris has spent a lot of time developing some of the best optical detection, the camera is used for stop bar and past-stop-bar detection, as well as turning movement counts.
The combination means you only need one sensor at each approach to give you all the detection you need for proper data for an SPM application.
Iteris: SPM in the Cloud
We get a lot of questions about the value of a cloud-based SPM versus a local server. There are several benefits to Iteris’ cloud-based SPM:
- Greater storage capacity — An ATSPM system collects a lot of data and it builds up quickly. Maintaining an on-prem server for that much data would get costly just for the storage space, nevermind housing and maintaining it. The cloud offers unlimited storage, so you can keep decades of data in case you need to compare YoY trends or review traffic patterns from a specific point in history.
- Less maintenance — Cloud-based servers are maintained by the hosting provider, so no one at the agency needs to worry about firmware or software updates.
- Less equipment — Storing and processing data in the cloud means you don’t have to go out and buy 100+ physical cards to plug into each and every intersection
Iteris ATSPM Data Visualizations and Reports
All of the data visualizations and reports that Iteris creates are easy to customize and all are downloadable for easy sharing and reporting. The following are just a few of the more popular views.
The Iteris SPM Dashboard with Built-In Alerts
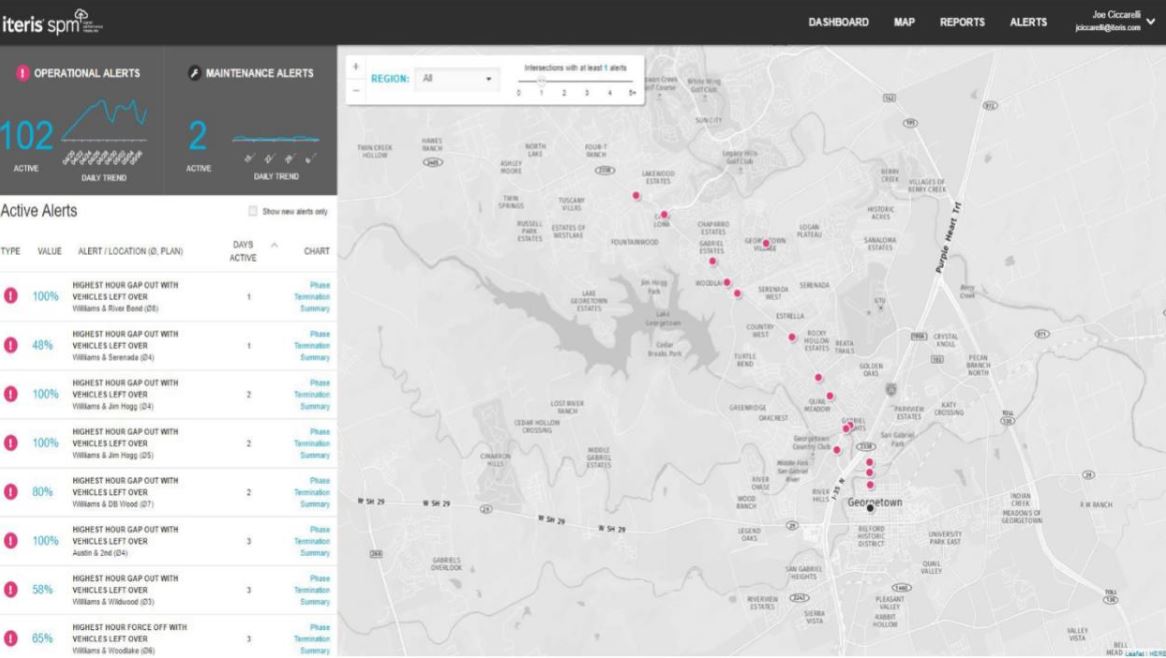
When users first log into the dashboard, they see this map with built-in alerts—represented by the pink dots. The alerts are split into operational and maintenance alerts, which is a unique feature that Iteris offers.
The more alerts there are at a given intersection, the larger those dots will appear. Hovering over an alert dot produces a pop-up that lists the available reports for that intersection, based on the kind of detection you have available. Clicking on those dots provides even more details.
Alert Configurations
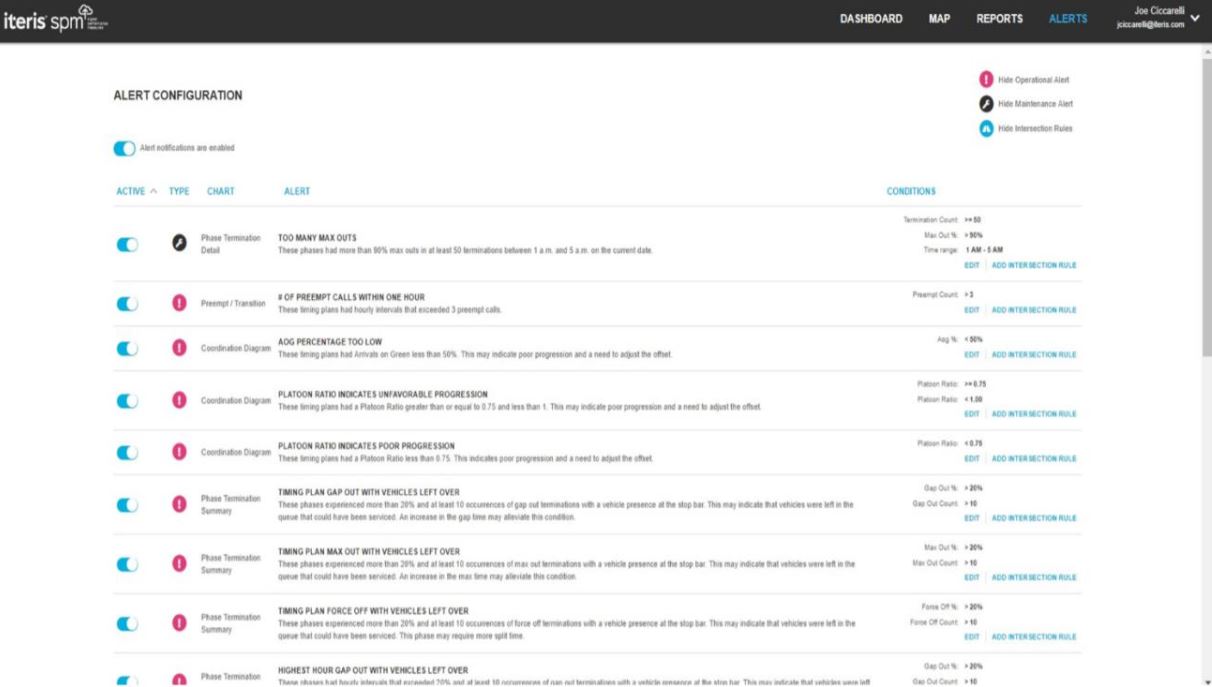
Iteris allows the agency to customize alerts to make them user- or intersection-specific. You can set time ranges, for example, so you don’t get needless alerts at three in the morning. You can also make sure that each team or user is getting the alerts they need; the maintenance team, for example, will want alerts about hardware failures but not necessarily changing traffic patterns.
Custom alerts are easy to set up and can be changed any time. The system will even give you a preview of what the alert configuration will look like in your email, so you can make sure it’s highlighting what’s most important to you.
Coordination Diagram
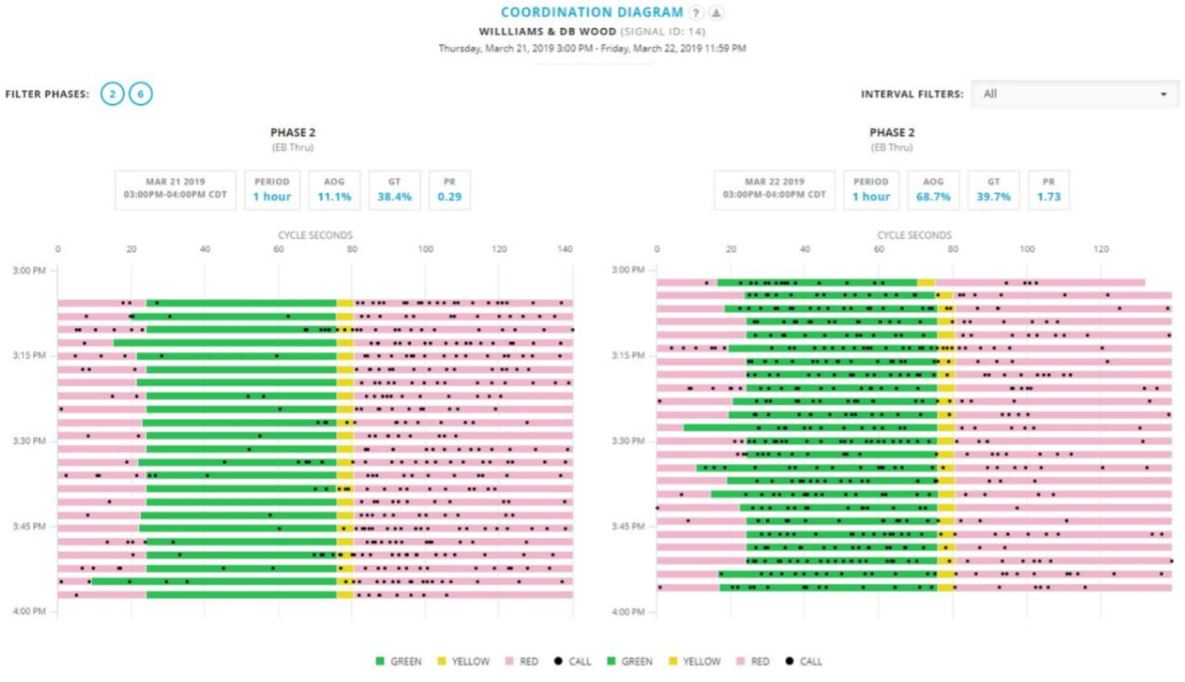
The coordination diagram is a popular visualization. This uses advanced detection to show where vehicles are arriving at the stop bar, relative to what the light is showing. Each wide column shows what phase you’re looking at, what plan it’s on, and how well your plan is doing.
The system scores your plan based on a really simple calculation. It takes the AOG (arrivals on green), divided by green time (the percentage of total time that the signal is green) to get a PR score. Iteris has told us that a PR score of 1.5 or higher means you’re serving people well at that intersection.
On the diagram itself, you can see the green, yellow, and red bars that mimic the signal colors and each black dot represents a vehicle stopping at the stop bar. This makes it really easy to understand how your plan is doing, because you can take in all this data in a glance. Obviously, you want as many of these black dots on the green portion of the diagram as possible.
Users can also change the date and time range on this view, so you can get as wide or as narrow a view as you need. You can also create a side-by-side comparison view, which is demonstrated in a case study, below.
Wait Times
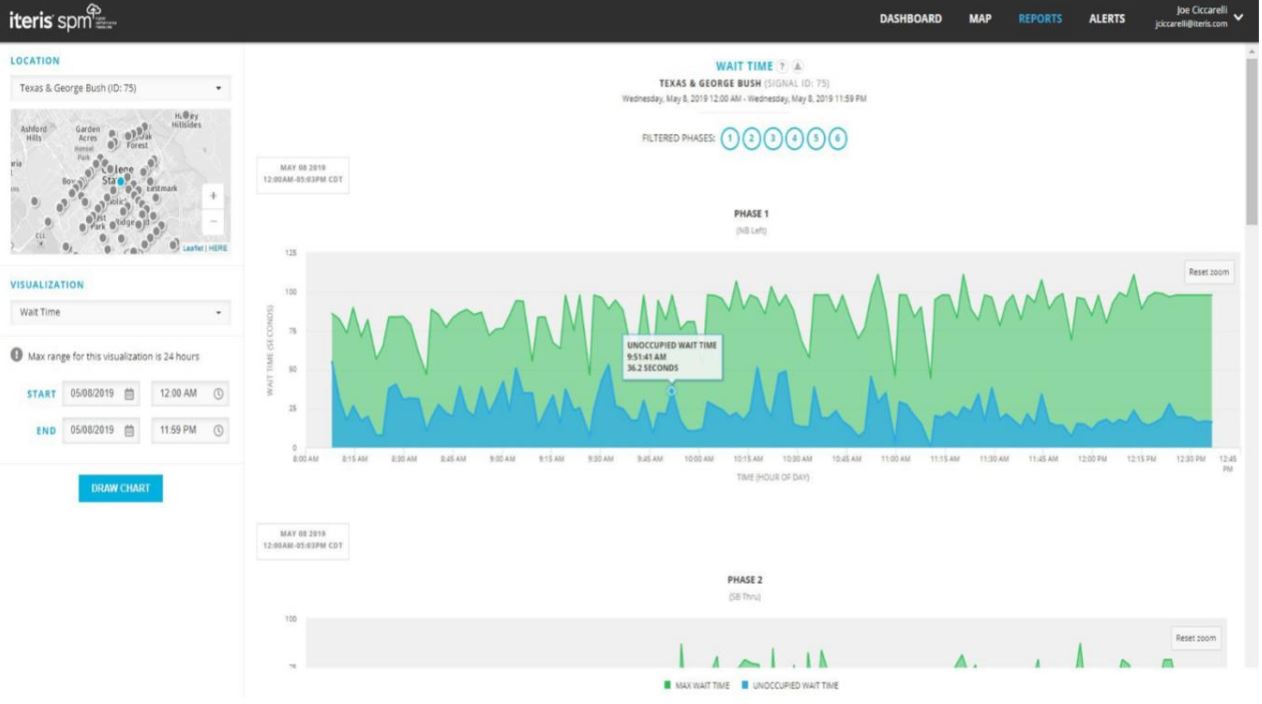
The Wait Time screen is another favorite. This shows max wait times versus unnecessary wait times. The green is total wait time, mapped over the time of day. The blue is unoccupied wait time—the time that vehicles were waiting at the stop bar when there wasn’t traffic going through the intersection.
We all know, from experience, that time slows down when you’re sitting at a red light, at an empty intersection. That’s when people complain. Some of the unnecessary wait times on this graph go as high as 30 to 50 seconds. If someone is sitting at the stop bar for a minute, without anyone else coming across the intersection, they’re going to perceive an issue at that intersection. This visualization helps agencies get ahead of those problems so they can take care of them before people complain.
Hovering over any of these plot points generates a pop-up that indicates exactly what time the wait occurred and how long the wait times where.
Phase Termination Details
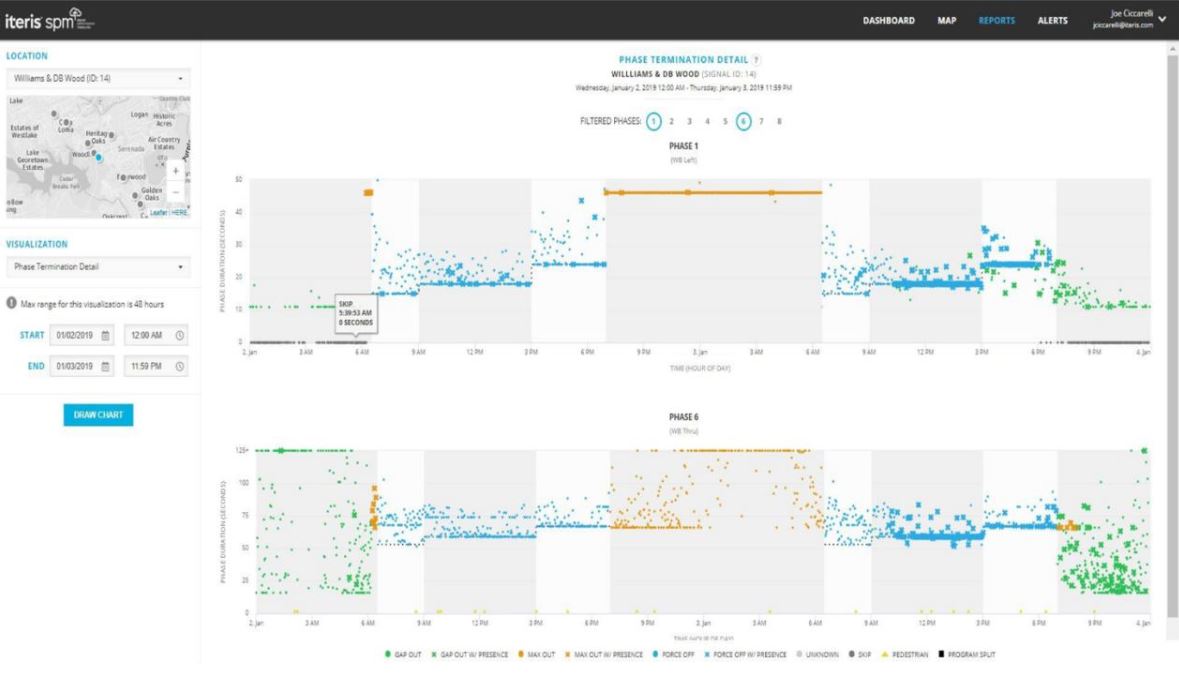
The Phase Termination Detail view displays every phase’s termination time and cause. The Xs mean that termination happened with presence, or when someone was at the stop bar.
- Gap outs are in green.
- Max outs are in orange.
- Force offs are in blue.
- Pedestrian calls are represented by yellow triangles.
All of the data on this screen can be filtered by user or by interaction. You can choose to view certain phases as the same time, indicate the time of day or a specific day. It’s all very intuitive.
Turning Movement Counts
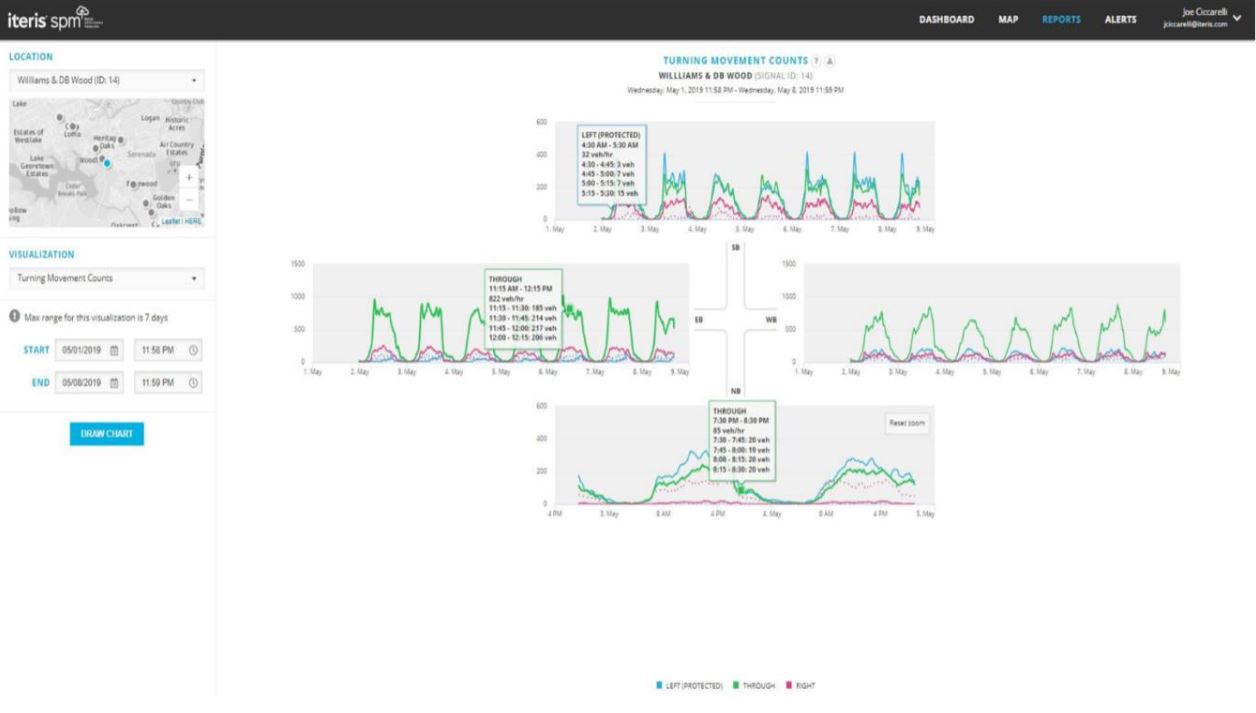
The Turning Movement Counts screen graphs hourly turn counts in 15-minute bins. The lines on these charts show right turns on red, right turns on green, and permissive/protected lefts.
If you hover over any point, a tool tip pops up to provide a breakdown of the data at that point in the graph. You can also click and drag on any of these charts to zoom in for a closer view. The diagram in the middle shows where these turns are coming from.
ATSPM for 2020: ClearGuide
Iteris’ latest release, as of the summer of 2020, is ClearGuide, which is being implemented into their SPMs.
ClearGuide is a proprietary, web-based, cloud-hosted service that analyzes traffic data, measures roadway performance, and provides tools and reports that detail actionable information for roadway network management. It processes data from various sources, including data from third-party traffic data providers.
Get Real-Time Data on a Fully Functional Map
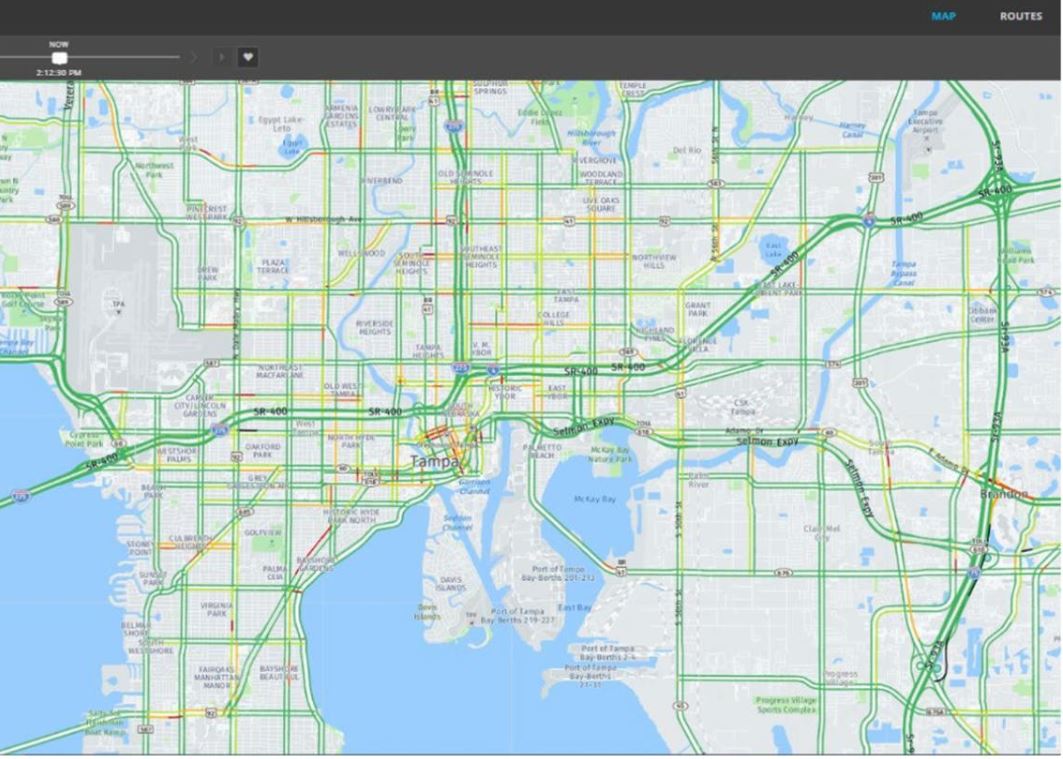
One of the best features of the ClearGuide service is the map functionality. It displays real-time and historic traffic data with several options for map layers, such as observed speed vs. free-flow speed, speed anomalies, roadway network classifications, and more.
This real-time data is pulled from several sources, which provides consistently reliable information.
- HERE technology is real-time data built on the aggregation of speed observations from over a billion vehicles traversing the roadway network. This data is available 24/7/365.
- Consumer and commercial devices in rural and urban environments. Years of testing has enabled Iteris to identify the appropriate blend of consumer and commercial devices to represent the reality of travel speeds and behaviors throughout the day.
View Traffic at a Specific Time and Save Records
The new slider tool allows users to easily choose any time for the day selected in the left sidebar. Clicking Play will then play that day from the moment you selected. The roadways change colors depending on how traffic was moving.
This can help agencies understand general traffic trends throughout the day, or observe how an event or emergency impacted traffic. If there was a major accident, for example, you could review the data to see how traffic reacted and how people tried to divert.
Additionally, the specific animation you just viewed can be easily saved for future reference. You can download it as an MP4 file, or just save it within the system to refer back to later.
Create and save routes
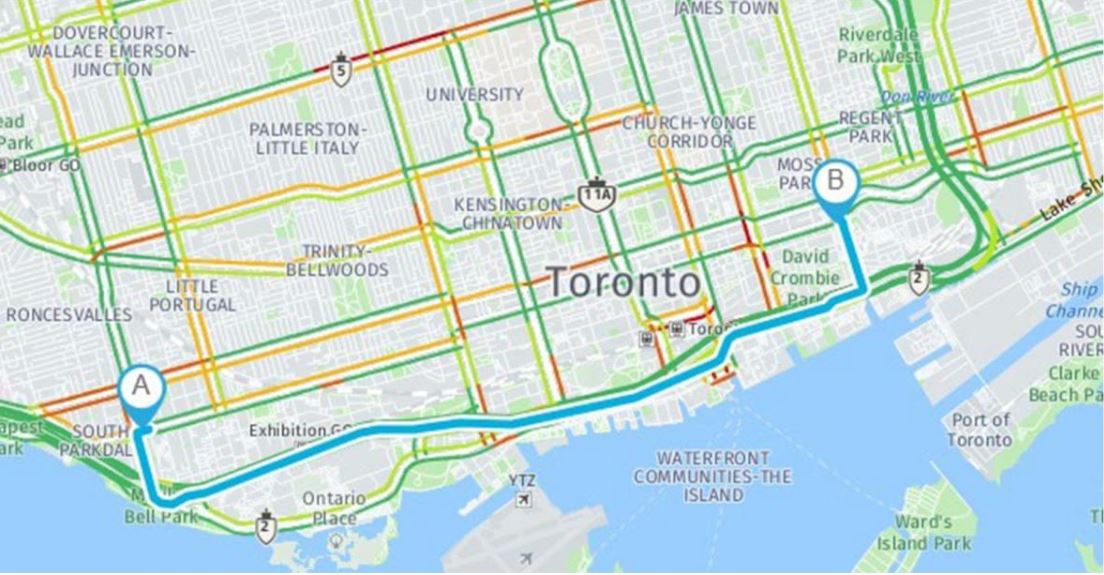
Clicking on the ClearGuide map to identify start and end points allows you to easily chart out a route that you want to monitor. You can also add way points if you want to see a specific way that drivers travel.
Users can then name and save those specific routes, in order to help you find them again later. The search tool within ClearGuide will quickly pull up a saved, named route, so you don’t even have to scroll through a long list to find it again.
Detect bottlenecks
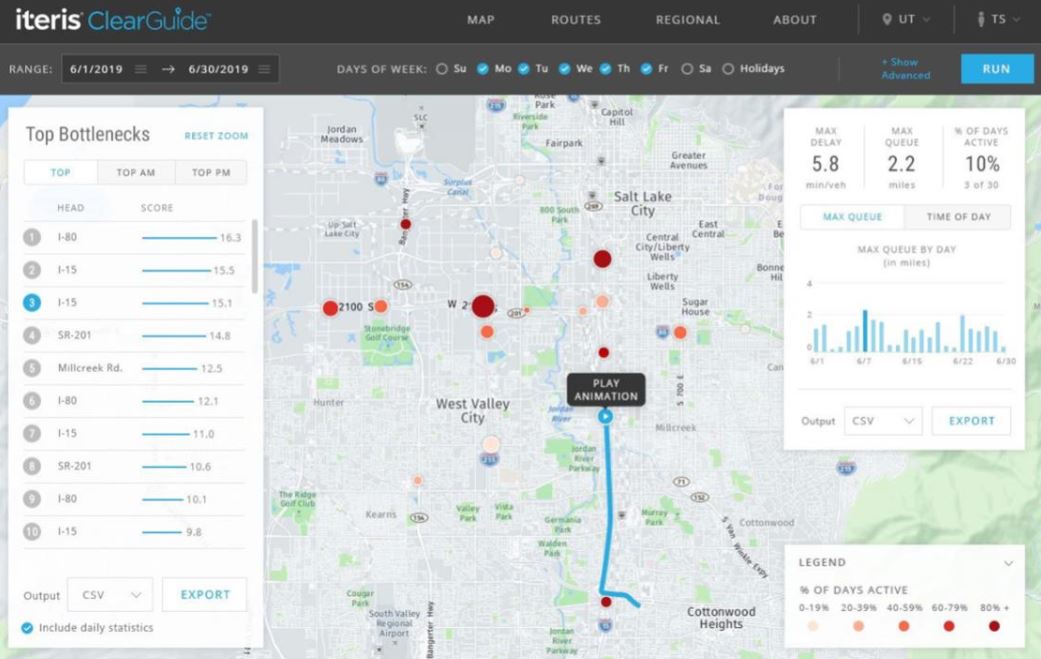
Bottleneck detection shows bottlenecks on the ClearGuide real-time map as an overlay on any of the other layers. The head node is marked by a pushpin icon and the queue length is a wide, red line overlaid on the road. Users can click on the pushpin to see details about the current queue length, the delay for each traveler in minutes, etc.
The window on the left lists your top 10 bottlenecks. You can display the top ten overall, throughout the entire day, or you can look at the top ten bottlenecks in the morning as opposed to the afternoon. You can also filter out bottlenecks below certain minimal delays or queue length thresholds.
View accidents and incidents in real-time
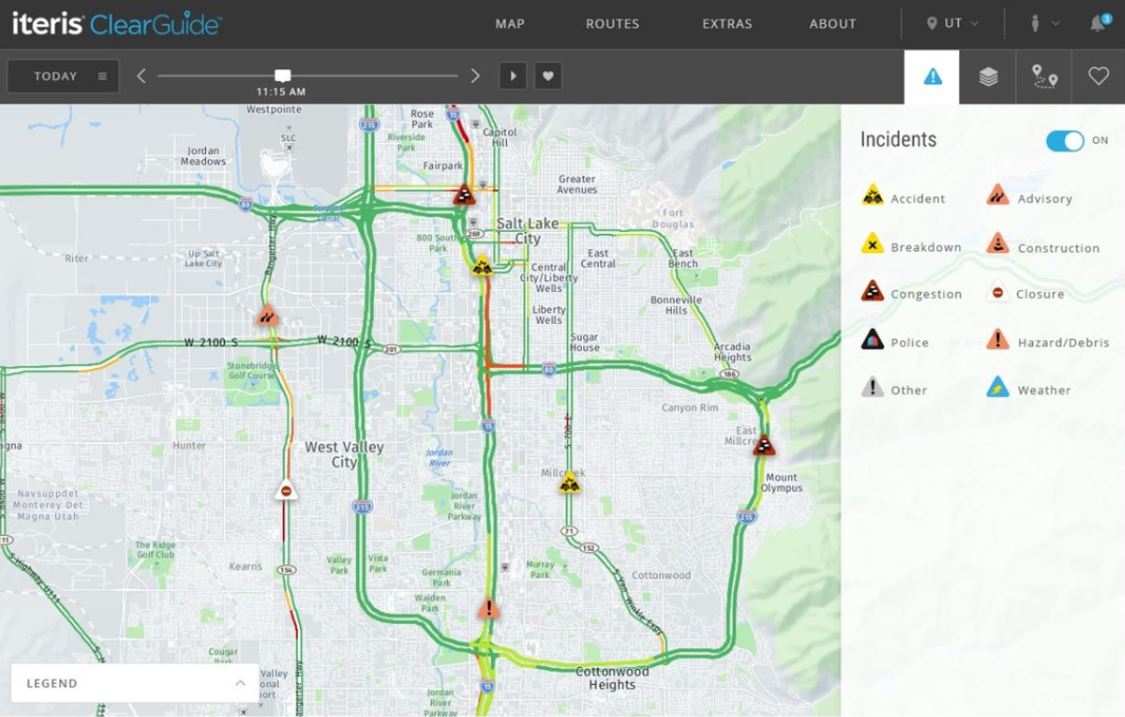
ClearGuide also offers an accident and incident feed that lays over your map. This view is fed by real-time data from HERE and Waze (if your agency is a Waze Connected Citizen Program partner), which means you’re getting reliable information from a huge data pool.
Waze allows users to report incidents and hazards that they see on the roadway, like fallen branches or a minor, bumper-to-bumper accident. After so many reports and confirmations, it appears here on your map. It will be removed from the map when the hazard is cleared.
This is still part of the slider tool, so you can see how long it took for an accident to clear up or how long a weather event impacted traffic.
Overlay weather on top of traffic patterns
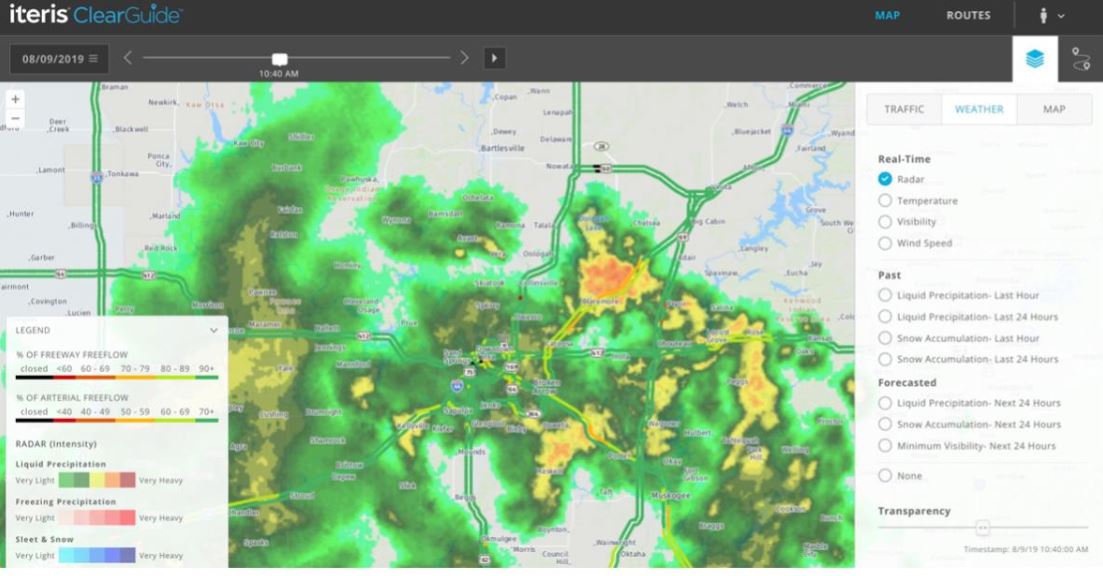
Finally, a much-anticipated feature that the ClearGuide map offers is this live weather overlay. This shows precipitation, predicted precipitation, snow accumulation, wind speeds, etc. You can play this animation through any day and watch the weather patterns and your roadways at the same time to see how a storm, for example, impacted traffic.
ATSPM for 2021 (and Beyond)
Agencies spend $30,000 to $40,000 on hardware for each intersection, but most are not seeing the full value of that investment. SPMs were a huge step forward, but keeping up with the needs of a modern agency requires something more.
Automated traffic signal performance measures is the missing piece that pulls it all together and gives you the data that you need to make objective, proactive decisions to optimize your roadways.
Western Systems partners with Iteris, because they are an industry leader in both detection hardware and SPM solutions. Their SPM service was designed by traffic engineers for traffic engineers, and offers unparalleled functionality.
And the Iteris system, and the new ClearGuide release, can do so much more than we covered here. If you’re interested in seeing more of what this system can do, we would be happy to set up a one-on-one demo and answer any questions.